top of page

Machine Learning on Diabetes Data Sets

Every year thousands of people are diagnosed with diabetes too late, and unfortunately a late, or untreated diagnosis can result in blindness, amputations, heart attacks, strokes, and kidney disease.​ Our aim was to run machine learning algorithms to the data in order to determine who is most at risk based on commonly known things about each patient. This will allow us to more accurately identify who is at risk, and allow us to catch diagnosis before it is too late. 

​We ran a logistic regression of our data to determine what has the largest correlation with our binary result of having diabetes and not having diabetes. The key results are as follows. glucose and insulin had the smallest standard error, however the probably value, or the likelihood that our results occurred by random chance are demonstrated below

  • Pregnancies (p = 0.000)

  • Glucose (p = 0.000)

  • BMI (p = 0.000)

  • Diabetes Pedigree Function (p = 0.002)

​

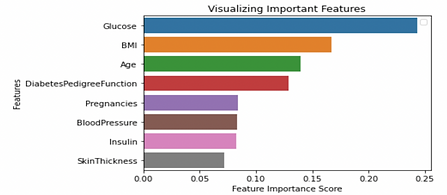
From this data in conjunction with the standard error, we determined that glucose is the ideal key factor in predicting diabetes. We also note that our 95% confidence interval for glucose does not include 0, so our result is statistically significant from zero.

​

This can be displayed by the correlation on the heat map that we made on the right. If you look at each key influencer compared to the outcome, we can note that glucose has a strong correlation seen on the Heat Map.

To further test this result we ran a bootstrap on our result for glucose. From our boot strap of the key result of the logistic regression, glucose levels, we determined that when we run 1000 iterations of random samples, we yielded a mean slope of 0.038 milligrams per deciliter which is extremely close to our slope of 0.0379.

Additionally we have a very small sample error of 0.04, demonstrating how statistically correlated glucose levels are to getting diabetes is. The slope is 0.038 because the samples of glucose range from 0 to 199 and our y axis, or outcome ranges from 0, not having diabetes to 1, having diabetes.

We created a decision tree for all of the features, or influencers, on diabetes to compare our results with this to our results with the logistic regression. This would provide another statistical interpretation on the data and increase the accuracy of our results.

From the decision tree we were able to further solidify the notion that glucose is the best predictor of having diabetes. We determined that Glucose has the smallest gini index, or impurity. Therefore, this was chosen as our initial split. From this, we note that if someone has a glucose level of less than 127.5 milligrams per deciliter and are under 28.5 years old they have the best chance of not having diabetes with a gini index of 0.155. If they have a glucose level greater than 127.5 and a BMI over 29.95 they most likely have diabetes with a gini index of 0.39.


Next, we imported the data and later used an alternative approach to the decision tree ,the random forest classifier, which is an ensembling method, which is an extension of the decision tree.

We decided to collect all relevant features and assigned the outcomes to the labels. We then partitioned 70% of the data as the training set and 30% of the data as the test set. Next, we imported the random forest model and its predictions returned an accuracy of approximately 76% in predicting whether a patient is at risk of getting diabetes.

Ideally, the results from these statistical and machine learning models can be used in the future to help predict diabetes diagnosis before it is too late. Future work in this area could involve larger data sets and neural networking to determine statistical correlations based on more data as well as an algorithm that compiles in realtime as data is put into it. If we can have even a marginal impact on catching undiagnosed diabetes in preliminary stages, then we can drastically change lives.


bottom of page